Market Outlook
November 03, 2017
Market Cues
Domestic Indices
Chg (%)
(Pts)
(Close)
Indian markets are likely to open positive tracking global indices and SGX Nifty.
BSE Sensex
(0.1)
(27)
33,573
Nifty
(0.2)
(17)
10,424
U.S. markets closed mostly higher on Thursday after a wild session as investors
examined the details of the tax-reform plan proposed by Republicans.
Mid Cap
0.5
79
16,725
Small Cap
0.4
72
17,769
The European markets ended Thursday's session with mixed results. Investors
Bankex
(0.2)
(50)
28,803
appear to have taken a bit of a breather after the markets flirted with 2-year highs.
The FTSE 100 of the UK outperformed the rest of Europe after the Bank of England
Global Indices
Chg (%)
(Pts)
(Close)
hiked interest rates.
Dow Jones
0.3
81
23,516
Indian markets closed Thursday's session marginally lower as muted global cues
Nasdaq
(0.0)
(2)
6,715
prompted traders to book some profits after strong gains in the previous session.
FTSE
0.9
67
7,555
Global markets were broadly cautious as the Federal Reserve signaled a December
Nikkei
0.5
119
22,539
rate hike and investors braced for the Bank of England's interest-rate decision as
well as the announcement on the nomination of the new Fed Chair.
Hang Seng
(0.3)
(75)
28,519
Shanghai Com
(0.4)
(13)
3,383
News Analysis
USFDA lifts import alert on Divi's Vizag plant
Advances / Declines
BSE
NSE
Godrej Agrovet: Book profit
Advances
1,324
855
Detailed analysis on Pg2
Declines
1,456
888
Unchanged
138
58
Investor’s Ready Reckoner
Key Domestic & Global Indicators
Volumes (` Cr)
Stock Watch: Latest investment recommendations on 150+ stocks
BSE
5,055
Refer Pg5 onwards
NSE
33,908
Top Picks
CMP
Target
Upside
Company
Sector
Rating
Net Inflows (` Cr)
Net
Mtd
Ytd
(`)
(`)
(%)
FII
1,043
1,043
39,495
Blue Star
Capital Goods
Buy
720
867
20.4
Dewan Housing Finance
Financials
Accumulate
650
690
6.2
MFs
(138)
(138)
95,272
Asian Granito
Other
Accumulate
503
570
13.4
Navkar Corporation
Other
Buy
194
265
37.0
Top Gainers
Price (`)
Chg (%)
KEI Industries
Capital Goods Accumulate
337
380
12.7
Infibeam
157
19.6
More Top Picks on Pg4
Divislab
1,074
16.7
Key Upcoming Events
Hexaware
319
13.9
Previous
Consensus
Date
Region
Event Description
Ghcl
250
9.2
Reading
Expectations
Nov03
US
Change in Nonfarm payrolls
(33.00)
312.00
Hindcopper
83
9.0
Nov03
China
Exports YoY%
8.10
7.00
Nov06
US
Unemployment rate
4.20
4.20
Top Losers
Price (`)
Chg (%)
Nov08
Germany PMI Services
55.20
Unionbank
171
(4.7)
Nov09
China
Consumer Price Index (YoY)
1.60
1.70
More Events on Pg7
Idfcbank
59
(4.6)
Techm
468
(4.3)
Icil
112
(3.8)
Hdil
59
(3.5)
As on November, 02 2017
Market Outlook
November 03, 2017
News Analysis
USFDA lifts import alert on Divi's Vizag plant
The US Food and Drug Administration (USFDA) informed Hyderabad-based Divi's
Laboratories Limited that it will be lifting import alert 66-40 and moving to close
out the warning letter issued to the company's Unit-2 at Visakhapatnam. With the
latest communication the import alert issued on Divi's Vizag facility on two
technical grounds comes to an end relatively quickly.
The company has not suffered any significant financial losses on account of the
import alert in the past seven months as the US drug regulator had exempted most
of the products from its action citing their importance for an adequate supply of
drugs made from these active ingredients in the US market. Earlier in July, the US
drug regulator had lifted import alert 99-32, which pertains to an alleged refusal
of inspection of the premises by the company. The import alert 66-40 relates to the
issues found in manufacturing compliance.
In March, Divi's facility came under the import alert after US drug regulator had
not satisfied with the remedial actions taken by the company in connection with the
Form 483 observations issued by the visiting inspection team during its audit from
November 29-December 6 last year.
Unlike in other recent instances where the USFDA had taken punitive actions
against the Indian pharma companies, Divis was able to quickly come out of the
regulatory scrutiny.
Godrej Agrovet: Book profit
We have a subscribe rating on Godrej Agrovet IPO. The stock at the CMP of
`564.25 is yielding 22.7% returns. We have put a subscribe rating on the IPO
based on its diversified business, track record of consistent profitability and strong
return profile. At the CMP of `564.25, stock is trading at the PE ratio of 40x of its
FY17 multiple and we advise to book profit at the CMP.
Economic and Political News
Govt hikes allowance for differently-abled kids of employees to `54,000
World food prices fall 1.3% in October as valuations drop: UN FAO
Huge business opportunities for textile, apparel in UAE: FIEO
Corporate News
Glenmark Q2 net down 4.23% at `214cr
Andhra Bank slips into `385cr loss on bad loan provisioning
Vedanta Q2 net up 47% to `2,091cr, misses estimates
Sundram Fasteners Q2 net up 17.5% to `90cr, revenue rises 10%
Market Outlook
November 03, 2017
Quarterly Bloomberg Brokers Consensus Estimate
Tata Power Ltd - Nov 03, 2017
Particulars ( ` cr)
2QFY18E
2QFY17
y-o-y (%)
1QFY18
q-o-q (%)
Sales
7,280
7,208
0.9
6,968
4.5
EBIDTA
1,631
1,078
51.3
1,587
2.8
%
22.4
14.9
22.7
PAT
439
336
30.7
163
169
Titan Ltd - Nov 03, 2017
Particulars ( ` cr)
2QFY18E
2QFY17
y-o-y (%)
1QFY18
q-o-q (%)
Sales
3,158
2,652
19.1
3,909
(19.3)
EBIDTA
320
273
17.3
378
(15.4)
%
10.2
10.3
9.7
PAT
220
180
22.2
266
(17.3)
PNB - Nov 03, 2017
Particulars ( `cr)
2QFY18E
2QFY17
y-o-y (%)
1QFY18
q-o-q (%)
PAT
386
549
(29.6)
343
12.6
Power Finance Corporation - Nov 01, 2017
Particulars ( `cr)
2QFY18E
2QFY17
y-o-y (%)
1QFY18
q-o-q (%)
PAT
1,770
1,873
(5.5)
1,428
23.9
Hindalco Ltd - Nov 03, 2017
Particulars ( ` cr)
2QFY18E
2QFY17
y-o-y (%)
1QFY18
q-o-q (%)
Sales
10,716
9,012
18.9
9,770
9.7
EBIDTA
1,314
1,096
19.9
1,043
25.9
%
12.3
12.2
10.7
PAT
495
439
12.8
290
70.6
Market Outlook
November 03, 2017
Top Picks ★★★★★
Market Cap
CMP
Target
Upside
Company
Rationale
(` Cr)
(`)
(`)
(%)
Strong growth in domestic business due to its leade`hip
in acute therapeutic segment. Alkem expects to launch
Alkem Laboratories
22,733
1,901
2,079
9.3
more products in USA, which bodes for its international
business.
We expect the company would report strong profitability
Asian Granito
1,512
503
570
13.4
owing to better product mix, higher B2C sales and
amalgamation synergy.
Favorable outlook for the AC industry to augur well for
Cooling products business which is out pacing the
Blue Star
6,894
720
867
20.4
market growth. EMPPAC division's profitability to
improve once operating environment turns around.
With a focus on the low and medium income (LMI)
consumer segment, the company has increased its
Dewan Housing Finance
20,373
650
690
6.2
presence in tier-II & III cities where the growth
opportunity is immense.
Loan growth is likely to pick up after a sluggish FY17.
Lower credit cost will help in strong bottom-line growth.
Karur Vysya Bank
7,714
128
180
41.0
Increasing share of CASA will help in NIM
improvement.
High order book execution in EPC segment, rising B2C
KEI Industries
2,623
337
380
12.7
sales and higher exports to boost the revenues and
profitability
Expected to benefit from the lower capex requirement
Music Broadcast
2,208
387
434
12.1
and 15 year long radio broadcast licensing.
Massive capacity expansion along with rail advantage
Navkar Corporation
2,759
194
265
37.0
at ICD as well CFS augur well for the company
Strong brands and distribution network would boost
Siyaram Silk Mills
2,791
595
650
9.2
growth going ahead. Stock currently trades at an
inexpensive valuation.
Market leadership in Hindi news genre and no.
2
viewership ranking in English news genre, exit from the
TV Today Network
2,122
356
435
22.3
radio business, and anticipated growth in ad spends by
corporate to benefit the stock.
After GST, the company is expected to see higher
volumes along with improving product mix. The Gujarat
Maruti Suzuki
2,48,168
8,215
8,658
5.4
plant will also enable higher operating leverage which
will be margin accretive.
We expect loan book to grow at 24.3% over next two
GIC Housing
2,602
483
655
35.5
year; change in borrowing mix will help in NIM
improvement..
Source: Company, Angel Research
Market Outlook
November 03, 2017
Key Upcoming Events
Result Calendar
D ate
C ompany
November 03, 2017
Punj ab N atl.Bank, Power Fin.Corpn., Uni on Bank, UCO Bank, Hindalco, Tata Power Co., VRL Logistics
November 04, 2017
S arda Energy, Relaxo
Source: Bloomberg, Angel Research
Global economic events release calendar
Bl oomberg Data
D ate
Time
C ountry
Event Description
Unit
Period
L ast Reporte d
E stimate d
Nov 03, 2017
6:00 PMUS
Change in N onfarm payrolls
Thousands
Oct
(33.00)
312.00
China
Exports YoY%
% Change
Oct
8.10
7.00
Nov 06, 2017
6:00 PMUS
Unnemployment rate
%
Oct
4.20
4.20
Nov 08, 2017
2:25 PMGermany PMI Services
Value
Oct F
55.20
Nov 09, 2017
7:00 AMChina
Consumer Price Index (YoY)
% Change
Oct
1.60
1.70
3:00 PMUK
Industrial Production (YoY)
% Change
Sep
1.60
Nov 10, 2017
India
Imports YoY%
% Change
Oct
18.09
India
Exports YoY%
% Change
Oct
25.67
5:30 PMIndia
Industrial Production YoY
% Change
Sep
4.30
Nov 14, 2017
3:30 PMEuro Zone Euro-Zone GDP s.a. (QoQ)
% Change
3Q P
0.60
7:30 AMChina
Industrial Production (YoY)
% Change
Oct
6.60
6.30
3:00 PMUK
CPI (YoY)
% Change
Oct
3.00
12: 00 PMIndia
Monthly Wholesale Prices YoY%
% Change
Oct
2.60
12: 30 PMGermany GDP nsa (YoY)
% Change
3Q P
0.80
US
Producer Price Index (mom)
% Change
Oct
0.80
Source: Bloomberg, Angel Research
Market Outlook
November 03, 2017
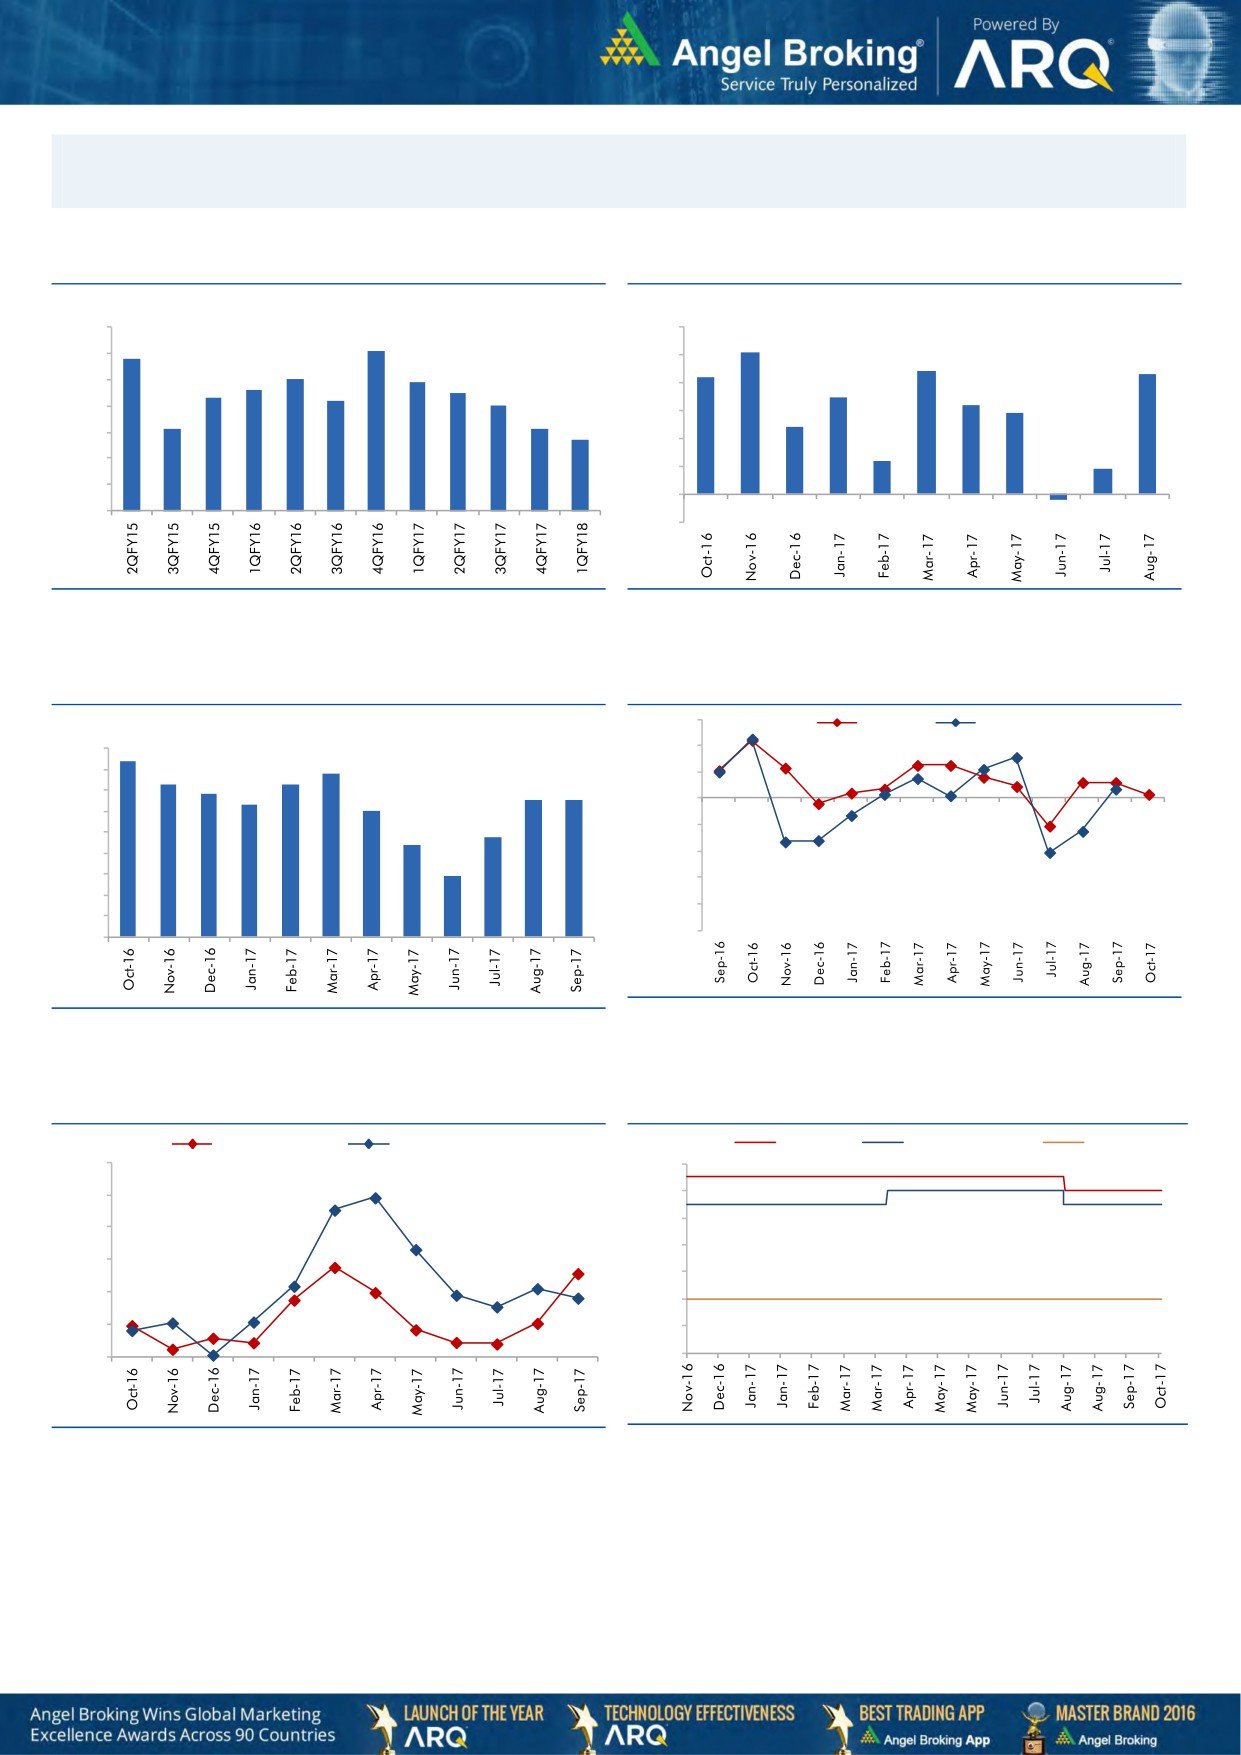
Macro watch
Exhibit 1: Quarterly GDP trends
Exhibit 2: IIP trends
(%)
(%)
10.0
6.0
9.1
5.1
8.8
9.0
5.0
4.4
4.3
8.0
7.9
4.2
7.6
7.5
8.0
7.3
7.2
4.0
3.5
7.0
3.2
2.9
7.0
6.1
6.1
3.0
2.4
5.7
6.0
2.0
1.2
0.9
5.0
1.0
4.0
-
3.0
(1.0)
(0.2)
Source: CSO, Angel Research
Source: MOSPI, Angel Research
Exhibit 3: Monthly CPI inflation trends
Exhibit 4: Manufacturing and services PMI
56.0
Mfg. PMI
Services PMI
(%)
4.5
4.2
54.0
3.9
4.0
3.6
3.7
52.0
3.4
3.3
3.3
3.5
3.2
3.0
50.0
3.0
2.2
2.4
48.0
2.5
2.0
46.0
1.5
1.5
44.0
1.0
42.0
0.5
40.0
-
Source: Market, Angel Research; Note: Level above 50 indicates expansion
Source: MOSPI, Angel Research
Exhibit 5: Exports and imports growth trends
Exhibit 6: Key policy rates
(%)
Exports yoy growth
Imports yoy growth
(%)
Repo rate
Reverse Repo rate
CRR
60.0
6.50
50.0
6.00
5.50
40.0
5.00
30.0
4.50
20.0
4.00
10.0
3.50
0.0
3.00
Source: Bloomberg, Angel Research
Source: RBI, Angel Research
Market Outlook
November 03, 2017
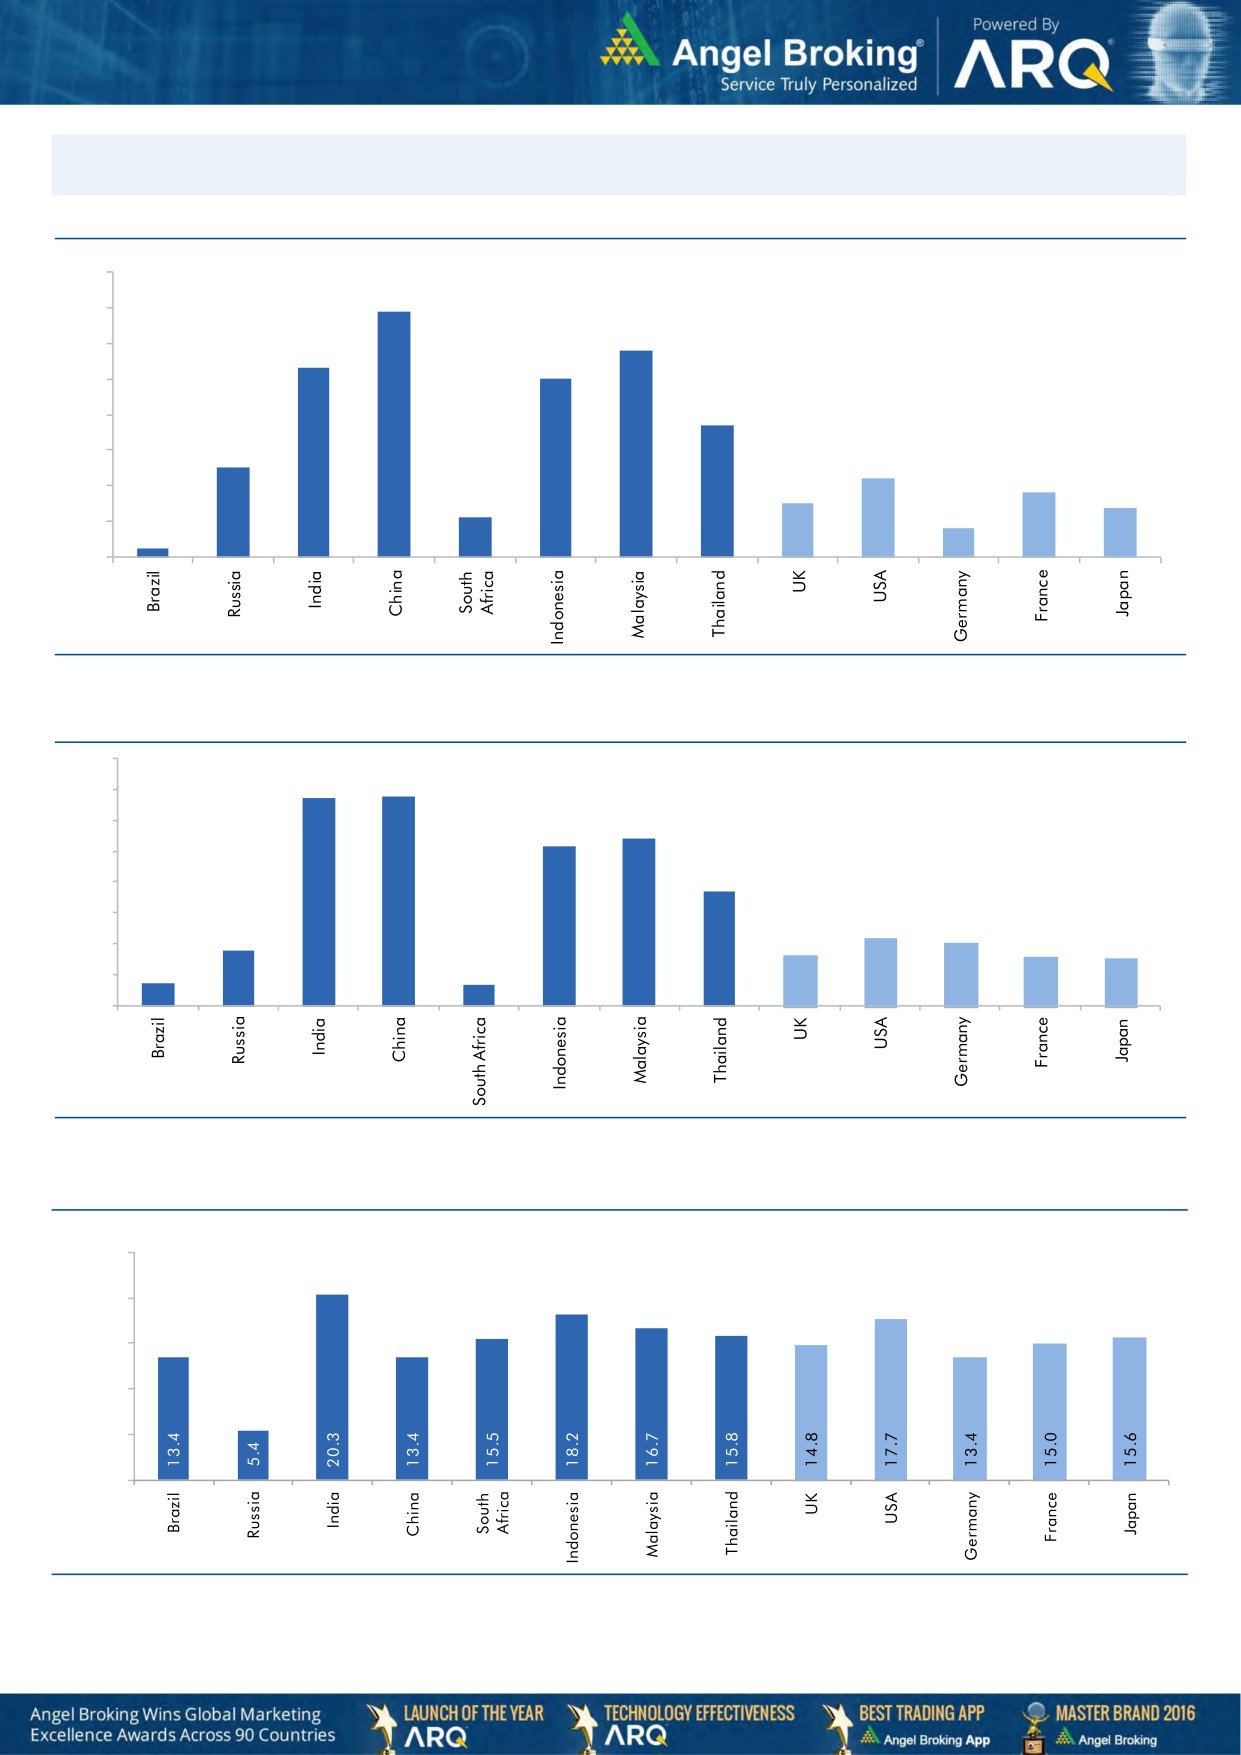
Global watch
Exhibit 1: Latest quarterly GDP Growth (%, yoy) across select developing and developed countries
(%)
8.0
6.9
7.0
5.8
6.0
5.3
5.0
5.0
1.1
3.7
4.0
2.5
3.0
2.2
1.8
2.0
1.5
1.4
0.8
1.0
0.3
-
Source: Bloomberg, Angel Research
Exhibit 2: 2017 GDP Growth projection by IMF (%, yoy) across select developing and developed countries
(%)
6.7
6.8
7.0
6.0
5.4
5.2
5.0
3.7
4.0
3.0
1.8
2.2
2.0
1.7
1.6
2.0
0.7
1.5
0.7
1.0
-
Source: IMF, Angel Research
Exhibit 3: One year forward P-E ratio across select developing and developed countries
(x)
25.0
20.0
15.0
10.0
5.0
-
Source: IMF, Angel Research
Stock Watch
November 03, 2017
Company Name
Reco
CMP
Target
Mkt Cap
Sales ( Čcr )
OPM(%)
EPS (Č)
PER(x)
P/BV(x)
RoE(%)
EV/Sales(x)
(Č)
Price ( Č)
( Č cr )
FY18E FY19E
FY18E
FY19E
FY18E
FY19E
FY18E
FY19E
FY18E
FY19E
FY18E
FY19E
FY18E
FY19E
Agri / Agri Chemical
Rallis
Reduce
242
209
4,699
1,873
2,099
15.0
15.0
9.5
10.5
25.4
23.0
3.9
3.5
15.8
16.0
2.4
2.2
United Phosphorus
Accumulate
779
820
39,571
18,922
21,949
18.0
18.5
36.2
45.6
21.5
17.1
4.5
3.7
22.7
23.8
2.3
1.9
Auto & Auto Ancillary
Ashok Leyland
Neutral
125
-
36,567
23,339
27,240
10.1
10.8
4.7
6.2
26.9
20.1
5.4
4.7
20.0
23.6
1.5
1.3
Bajaj Auto
Neutral
3,239
-
93,712
23,936
27,955
19.5
20.1
142.7
167.3
22.7
19.4
4.9
4.4
21.8
22.8
3.5
2.9
Bharat Forge
Buy
696
875
32,398
7,637
8,755
21.7
23.2
36.1
47.3
19.3
14.7
3.5
3.0
18.5
20.8
4.1
3.5
Eicher Motors
Neutral
31,140
-
84,772
19,043
22,837
19.5
19.9
835.4
1,019.0
37.3
30.6
13.9
10.7
40.9
37.8
4.3
3.6
Gabriel India
Neutral
198
-
2,851
1,782
2,033
9.7
10.2
7.1
8.9
28.0
22.4
5.6
4.8
21.0
22.2
1.6
1.3
Hero Motocorp
Accumulate
3,733
4,129
74,548
32,239
36,878
16.0
15.6
184.4
206.5
20.3
18.1
6.4
5.6
31.3
30.7
2.1
1.8
Jamna Auto Industries Neutral
65
-
2,600
1,441
1,662
14.4
14.8
13.9
17.6
4.7
3.7
1.3
1.0
30.0
31.0
1.8
1.5
Mahindra and Mahindra Neutral
1,335
-
82,931
46,971
53,816
13.6
14.0
67.7
79.8
19.7
16.7
2.8
2.5
15.0
15.9
1.7
1.4
Maruti
Accumulate
8,215
8,658
248,168
81,825
101,245
15.0
15.0
283.5
356.0
29.0
23.1
6.3
5.2
21.9
22.4
2.7
2.1
Minda Industries
Neutral
901
-
7,788
4,328
5,084
11.0
11.9
27.3
36.4
33.1
24.8
7.0
5.5
23.1
25.6
1.9
1.6
Motherson Sumi
Neutral
363
-
76,491
55,937
64,445
10.8
11.4
16.9
21.1
21.5
17.3
4.8
4.9
25.2
25.4
1.4
1.2
Tata Motors
Neutral
435
-
125,542
303,167
343,649
11.8
13.8
33.1
54.7
13.1
8.0
2.2
1.7
16.9
23.0
0.5
0.4
TVS Motor
Neutral
708
-
33,646
13,992
16,216
9.0
9.4
17.1
20.3
41.5
34.9
11.0
8.5
29.7
27.7
2.3
2.0
Amara Raja Batteries
Buy
692
858
11,822
6,140
7,122
14.3
15.6
29.3
39.0
23.6
17.7
4.0
3.4
17.1
19.0
1.9
1.7
Exide Industries
Neutral
209
-
17,761
8,689
9,854
15.1
15.2
9.7
11.0
21.7
19.0
3.8
3.4
15.7
16.1
1.8
1.5
Apollo Tyres
Neutral
237
-
12,066
15,739
17,326
13.3
14.6
20.4
26.7
11.6
8.9
1.4
1.2
20.4
26.7
1.0
0.9
Ceat
Neutral
1,688
-
6,827
6,661
7,717
11.1
14.2
116.2
178.2
14.5
9.5
2.5
2.1
15.2
21.3
1.1
1.0
JK Tyres
Neutral
145
-
3,289
8,318
9,239
16.2
16.4
21.0
27.5
6.9
5.3
1.3
1.1
19.1
20.4
0.8
0.7
Swaraj Engines
Neutral
1,996
-
2,479
788
889
16.4
16.5
71.6
81.0
27.9
24.7
8.0
7.5
29.6
31.0
2.8
2.4
Subros
Neutral
258
-
1,546
1,855
2,135
11.6
11.8
10.3
14.7
25.1
17.6
3.8
3.3
15.8
19.1
1.0
0.9
Capital Goods
BEML
Neutral
1,720
-
7,164
4,286
5,194
7.1
8.2
42.9
58.1
40.1
29.6
3.3
3.0
7.6
8.7
1.7
1.4
Bharat Electronics
Neutral
185
-
45,516
10,258
12,470
19.6
19.5
7.3
8.6
25.4
21.5
0.5
0.4
20.4
21.9
3.9
3.2
Voltas
Neutral
545
-
18,048
6,778
8,004
9.6
11.0
17.1
22.4
31.9
24.4
7.6
6.7
17.7
19.8
2.4
2.0
BHEL
Neutral
98
-
35,833
33,200
39,167
6.8
9.5
6.2
11.2
15.7
8.7
0.7
0.7
4.6
8.0
0.7
0.5
Blue Star
Buy
720
867
6,894
5,220
6,207
6.3
6.6
16.8
22.3
42.8
32.3
8.5
7.5
19.9
23.3
1.3
1.1
CG Power and Industrial
Neutral
85
-
5,356
6,555
7,292
7.5
7.5
-
0.8
8,545.0
106.8
1.3
1.3
0.1
1.2
0.9
0.8
Solutions
Greaves Cotton
Neutral
128
-
3,130
1,778
1,993
14.7
15.1
8.1
9.1
15.8
14.1
3.6
3.3
21.8
23.6
1.5
1.4
Stock Watch
November 03, 2017
Company Name
Reco
CMP
Target
Mkt Cap
Sales ( Čcr )
OPM(%)
EPS (Č)
PER(x)
P/BV(x)
RoE(%)
EV/Sales(x)
(Č)
Price ( Č)
( Č cr )
FY18E FY19E
FY18E
FY19E
FY18E
FY19E
FY18E
FY19E
FY18E
FY19E
FY18E
FY19E
FY18E
FY19E
Capital Goods
KEC International
Accumulate
306
350
7,859
9,779
11,113
9.4
9.8
14.2
18.2
21.5
16.8
4.1
3.4
21.1
22.1
1.1
0.9
KEI Industries
Accumulate
337
380
2,623
3,001
3,391
10.0
10.0
13.0
16.1
25.9
20.9
4.7
3.9
18.2
18.7
1.1
0.9
Thermax
Neutral
975
-
11,615
4,125
4,747
10.3
10.8
26.7
31.5
36.5
30.9
4.1
3.7
11.2
12.0
2.5
2.2
VATech Wabag
Buy
588
681
3,210
3,867
4,126
9.6
10.0
34.9
39.8
16.9
14.8
2.8
2.4
17.7
17.5
0.8
0.8
Cement
ACC
Neutral
1,799
-
33,782
12,255
13,350
13.5
14.3
58.0
66.2
31.0
27.2
3.7
3.4
11.5
12.2
2.7
2.5
Ambuja Cements
Neutral
280
-
55,509
10,250
11,450
17.5
19.0
7.2
8.3
38.8
33.7
2.8
2.6
7.0
7.8
5.2
4.6
India Cements
Neutral
189
-
5,838
6,135
6,750
14.8
15.2
8.5
11.5
22.3
16.5
1.1
1.1
4.8
6.2
1.3
1.1
JK Cement
Neutral
1,004
-
7,021
4,150
4,775
19.2
20.0
49.0
63.5
20.5
15.8
3.2
2.8
17.0
18.5
2.1
1.8
J K Lakshmi Cement
Neutral
437
-
5,142
3,422
3,757
15.5
17.0
13.5
23.2
32.4
18.8
3.4
2.9
10.8
15.5
1.9
1.7
Orient Cement
Neutral
179
-
3,657
2,215
3,233
16.8
17.0
5.9
6.9
30.3
25.9
2.3
2.1
10.8
10.1
2.6
1.8
UltraTech Cement
Neutral
4,398
-
120,740
28,250
35,150
20.2
23.5
77.5
122.2
56.8
36.0
4.8
4.3
9.6
14.8
4.7
3.8
Construction
KNR Constructions
Neutral
277
-
3,892
1,846
2,203
14.5
14.5
12.1
13.7
22.9
20.3
1.3
1.1
17.5
16.7
2.2
1.8
Larsen & Toubro
Neutral
1,211
-
169,613
95,787
109,476
10.2
11.6
44.5
50.8
27.3
23.9
3.4
3.1
12.9
13.1
2.3
2.1
Gujarat Pipavav Port
Neutral
138
-
6,688
739
842
61.6
62.7
5.1
6.2
27.1
22.5
3.4
3.3
12.7
14.9
8.5
7.3
PNC Infratech
Neutral
204
-
5,230
2,040
2,935
13.0
13.0
6.4
9.0
31.9
22.7
0.8
0.7
9.7
12.2
2.6
1.8
Simplex Infra
Neutral
527
-
2,607
6,012
6,619
11.6
11.7
21.1
31.0
25.0
17.0
1.7
1.6
6.5
8.6
1.0
0.9
Sadbhav Engineering
Neutral
311
-
5,328
3,823
4,426
10.7
10.8
10.3
11.8
30.2
26.3
3.6
3.2
10.1
10.5
1.7
1.5
NBCC
Neutral
263
-
23,630
9,099
12,706
6.4
6.4
7.3
9.6
36.1
27.5
1.6
1.3
27.5
30.5
2.5
1.8
MEP Infra
Neutral
106
-
1,724
2,403
2,910
18.3
16.8
2.4
6.1
45.1
17.5
17.1
11.5
35.2
55.8
1.9
1.5
SIPL
Neutral
127
-
4,484
2,060
2,390
46.8
47.7
(5.8)
(3.1)
4.8
5.4
(14.2)
(2.3)
6.9
6.5
Engineers India
Neutral
184
-
12,369
1,795
2,611
21.1
22.4
5.9
8.1
31.1
22.7
2.2
2.2
12.9
16.1
5.3
3.5
Financials
Axis Bank
Accumulate
530
580
127,097
32,558
35,843
3.5
3.2
27.8
41.0
19.1
12.9
2.1
1.8
11.4
14.9
-
-
Bank of Baroda
Neutral
169
-
39,032
22,533
26,079
2.4
2.4
12.0
20.9
14.1
8.1
0.9
0.9
6.6
11.0
-
-
Canara Bank
Neutral
403
-
24,050
17,925
20,235
2.0
2.1
18.5
36.5
21.8
11.0
0.8
0.8
3.4
6.2
-
-
Can Fin Homes
Buy
473
2,128
6,290
586
741
3.5
3.5
107.8
141.0
4.4
3.4
1.0
0.8
24.1
25.6
-
-
Cholamandalam Inv. &
Neutral
1,244
-
19,442
2,826
3,307
6.3
6.3
53.7
64.6
23.2
19.3
4.0
3.4
18.3
18.9
-
-
Fin. Co.
Dewan Housing Finance Accumulate
650
690
20,373
2,676
3,383
2.4
2.7
37.4
49.7
17.4
13.1
2.3
2.0
13.8
16.2
-
-
Equitas Holdings
Buy
144
235
4,891
1,125
1,380
9.6
9.8
1.5
6.0
96.2
24.1
2.2
2.0
2.4
8.2
-
-
Federal Bank
Accumulate
118
125
23,035
4,896
5,930
2.8
3.1
5.4
7.6
22.0
15.6
1.9
1.7
8.5
11.0
-
-
Stock Watch
November 03, 2017
Company Name
Reco
CMP
Target
Mkt Cap
Sales ( Čcr )
OPM(%)
EPS (Č)
PER(x)
P/BV(x)
RoE(%)
EV/Sales(x)
(Č)
Price ( Č)
( Č cr )
FY18E FY19E
FY18E
FY19E
FY18E
FY19E
FY18E
FY19E
FY18E
FY19E
FY18E
FY19E
FY18E
FY19E
Financials
GIC Housing
Buy
483
655
2,602
376
477
3.6
3.7
33.0
40.0
14.6
12.1
2.6
2.2
20.0
23.0
-
-
HDFC Bank
Neutral
1,822
-
470,856
55,236
63,253
4.5
4.4
68.9
82.4
26.5
22.1
4.6
3.8
18.7
18.5
-
-
ICICI Bank
Neutral
317
-
203,167
42,361
51,378
3.6
3.9
18.4
25.7
17.2
12.3
1.9
1.8
11.3
15.0
-
-
Karur Vysya Bank
Buy
128
180
7,714
3,289
3,630
3.7
3.9
10.8
14.1
11.8
9.1
1.4
1.3
12.5
14.7
-
-
LIC Housing Finance
Neutral
605
-
30,550
4,895
6,332
3.4
3.7
50.7
66.8
11.9
9.1
2.4
2.0
21.7
23.8
-
-
Punjab Natl.Bank
Neutral
197
-
41,985
23,708
25,758
2.1
2.1
5.9
16.4
33.6
12.0
1.0
0.9
3.0
8.3
-
-
RBL Bank
Neutral
523
-
21,613
2,309
2,888
2.6
2.5
16.4
19.1
32.0
27.4
4.0
3.6
13.3
13.8
-
-
Repco Home Finance
Buy
613
825
3,838
496
597
4.4
4.2
38.5
48.7
16.0
12.6
2.9
2.4
19.6
20.6
-
-
South Ind.Bank
Neutral
31
-
5,530
3,195
3,567
3.0
3.1
3.0
3.8
10.2
8.0
1.0
0.9
10.5
11.9
-
-
St Bk of India
Neutral
315
-
271,866
105,827
121,056
2.4
2.5
16.1
25.6
19.6
12.3
1.5
1.4
6.6
9.9
-
-
Union Bank
Neutral
171
-
12,411
14,650
16,225
2.3
2.3
23.1
32.5
7.4
5.3
0.6
0.5
7.1
9.2
-
-
Yes Bank
Neutral
320
-
73,364
11,088
13,138
3.0
2.9
84.0
99.3
3.8
3.2
0.6
0.5
16.3
16.8
-
-
FMCG
Akzo Nobel India
Neutral
1,923
-
9,223
3,164
3,607
13.8
13.7
58.6
67.9
32.8
28.3
8.1
7.1
24.5
25.1
2.8
2.4
Asian Paints
Neutral
1,179
-
113,041
17,603
20,615
18.6
18.6
2,128.9
2,543.3
0.6
0.5
11.7
9.8
28.0
28.9
6.2
5.2
Britannia
Neutral
4,658
-
55,922
9,690
11,278
14.8
15.4
84.0
101.0
55.5
46.1
20.2
16.1
40.6
39.0
5.7
4.9
Colgate
Neutral
1,039
-
28,263
4,420
5,074
24.9
25.3
28.6
32.8
36.3
31.7
14.3
11.6
43.8
40.5
6.1
5.3
Dabur India
Neutral
342
-
60,297
8,346
9,344
19.6
19.9
7.8
9.0
43.9
38.0
8.8
8.0
25.2
24.8
6.8
6.0
GlaxoSmith Con*
Neutral
5,360
-
22,543
5,072
5,760
18.2
18.4
176.3
199.2
30.4
26.9
6.5
5.8
21.2
21.7
3.8
3.3
Godrej Consumer
Neutral
978
-
66,634
10,171
11,682
20.8
21.5
21.7
27.1
45.1
36.1
10.1
8.7
22.3
23.4
6.7
5.8
HUL
Neutral
1,240
-
268,352
37,077
41,508
20.3
21.8
5,189.9
6,318.5
0.2
0.2
37.8
32.3
74.8
82.0
7.1
6.3
ITC
Neutral
266
-
323,509
44,588
49,853
37.0
37.3
9.6
11.0
27.7
24.2
6.8
6.5
25.1
27.3
6.7
6.0
Marico
Neutral
312
-
40,321
6,788
7,766
18.5
19.2
7.1
8.5
44.0
36.8
15.4
13.2
36.9
38.0
5.8
5.0
Nestle*
Neutral
7,268
-
70,076
10,083
11,182
20.0
20.9
119.7
141.3
60.7
51.4
214.0
195.6
36.7
39.8
6.6
5.9
Tata Global
Neutral
226
-
14,286
7,121
7,641
11.9
12.3
6.9
8.0
32.8
28.3
2.2
2.1
6.8
7.2
1.8
1.7
Procter & Gamble
Neutral
8,795
-
28,549
3,034
3,579
27.1
27.7
167.7
198.8
52.4
44.2
14.1
12.1
28.8
29.5
8.8
7.4
Hygiene
IT
HCL Tech^
Buy
856
1,014
122,107
50,009
54,608
22.1
22.1
62.8
67.6
13.6
12.7
3.1
2.6
22.4
20.6
2.1
1.8
Infosys
Buy
923
1,120
211,989
70,333
75,960
26.0
26.0
61.7
65.9
15.0
14.0
2.8
2.6
18.9
18.7
2.4
2.2
TCS
Neutral
2,626
-
517,395
123,384
134,488
26.1
26.1
133.2
143.7
19.7
18.3
5.4
5.1
27.6
27.8
3.9
3.5
Tech Mahindra
Accumulate
468
526
45,648
30,545
32,988
15.0
15.0
35.2
37.6
13.3
12.4
2.2
2.0
16.8
16.2
1.3
1.1
Stock Watch
November 03, 2017
Company Name
Reco
CMP
Target
Mkt Cap
Sales ( Čcr )
OPM(%)
EPS (Č)
PER(x)
P/BV(x)
RoE(%)
EV/Sales(x)
(Č)
Price ( Č)
( Č cr )
FY18E FY19E
FY18E
FY19E
FY18E
FY19E
FY18E
FY19E
FY18E
FY19E
FY18E
FY19E
FY18E
FY19E
IT
Wipro
Neutral
293
-
142,618
54,164
56,544
22.3
22.3
18.8
19.5
15.6
15.0
2.5
2.2
15.0
13.6
1.9
1.6
Media
D B Corp
Neutral
367
-
6,742
2,404
2,625
30.5
31.5
23.7
26.9
15.5
13.6
3.6
3.1
23.5
22.8
2.6
2.4
HT Media
Neutral
103
-
2,386
2,589
2,830
15.1
15.4
8.3
10.9
12.4
9.4
1.0
0.9
8.4
10.4
0.5
0.3
Jagran Prakashan
Buy
179
225
5,860
2,541
2,835
28.5
28.7
12.7
14.1
14.1
12.7
2.9
2.5
21.3
21.4
2.2
1.9
Sun TV Network
Neutral
854
-
33,661
3,238
3,789
51.9
55.1
30.9
38.0
27.6
22.5
7.9
6.9
30.0
31.0
9.9
8.4
Hindustan Media
Neutral
234
-
1,719
1,002
1,074
23.3
23.5
29.2
33.8
8.0
6.9
1.3
1.1
15.6
15.4
0.7
0.5
Ventures
TV Today Network
Buy
356
435
2,122
667
727
27.7
27.7
18.6
20.1
19.1
17.7
3.0
3.0
15.6
17.3
2.7
2.5
Music Broadcast Limited Accumulate
387
434
2,208
271
317
91.0
109.0
6.0
10.0
64.5
38.7
4.0
3.7
6.5
9.3
7.7
6.4
Metals & Mining
Coal India
Neutral
292
-
181,039
82,301
91,235
17.0
18.0
17.1
20.5
17.1
14.2
3.2
3.0
45.0
55.0
1.9
1.7
Hind. Zinc
Neutral
322
-
135,886
22,108
24,555
57.0
58.0
22.1
26.3
14.6
12.2
4.7
3.8
32.0
35.0
5.2
4.3
Hindalco
Neutral
270
-
60,611
102,350
105,355
13.5
14.5
21.5
24.5
12.6
11.0
1.7
1.5
15.0
15.2
1.2
1.1
JSW Steel
Neutral
266
-
64,395
64,500
68,245
21.1
21.5
20.1
21.2
13.3
12.6
2.4
2.1
-
-
1.7
1.7
NMDC
Neutral
129
-
40,862
10,209
11,450
47.0
48.0
11.1
12.1
11.6
10.7
1.6
1.5
-
-
3.5
3.2
SAIL
Neutral
80
-
32,979
54,100
63,555
3.0
10.0
(10.0)
1.5
53.2
1.1
1.1
-
-
1.6
1.4
Vedanta
Neutral
341
-
126,682
81,206
87,345
28.0
29.0
26.5
33.5
12.9
10.2
2.9
2.5
-
-
2.3
2.0
Tata Steel
Neutral
706
-
68,568
121,445
126,500
16.2
17.2
65.4
81.3
10.8
8.7
1.7
1.5
-
-
1.1
1.0
Oil & Gas
GAIL
Neutral
472
-
79,762
53,115
52,344
14.2
15.3
30.0
31.1
15.7
15.2
2.0
1.8
-
-
1.2
1.2
ONGC
Neutral
188
-
241,265
83,111
84,934
44.2
44.9
16.4
16.9
11.5
11.1
1.4
1.3
-
-
2.8
2.7
Indian Oil Corp
Neutral
415
-
201,496
396,116
432,560
8.5
8.8
40.1
42.2
10.4
9.8
1.8
1.6
-
-
0.7
0.6
Reliance Industries
Neutral
947
-
615,975
257,711
267,438
17.0
18.2
89.1
89.5
10.6
10.6
1.0
0.9
-
-
2.0
2.0
Pharmaceuticals
Alembic Pharma
Buy
514
600
9,684
3,903
4,584
18.2
19.2
21.8
27.2
23.6
18.9
4.3
3.6
19.8
20.6
2.5
2.1
Alkem Laboratories Ltd
Accumulate
1,901
2,079
22,733
6,320
7,341
17.5
19.8
72.7
96.6
26.2
19.7
4.6
3.9
16.7
18.7
3.5
3.0
Aurobindo Pharma
Neutral
789
-
46,235
17,086
19,478
22.1
22.0
44.7
51.4
17.7
15.4
3.9
3.2
24.7
22.7
2.8
2.5
Aventis*
Neutral
4,674
-
10,764
2,508
2,862
16.8
16.8
139.9
153.8
33.4
30.4
4.9
3.9
23.5
25.8
3.9
3.2
Cadila Healthcare
Sell
509
426
52,098
11,584
13,228
20.3
20.4
18.7
21.3
27.2
23.9
6.1
5.0
24.6
22.9
4.3
3.7
Cipla
Sell
634
458
50,981
16,619
19,437
15.4
16.2
19.7
24.3
32.2
26.1
3.7
3.3
12.0
13.2
3.2
2.7
Dr Reddy's
Neutral
2,405
-
39,880
15,844
17,973
17.6
18.2
91.7
111.0
26.2
21.7
3.0
2.7
11.9
13.0
2.7
2.4
GSK Pharma*
Neutral
2,616
-
22,161
3,260
3,651
15.0
18.0
46.1
58.6
56.8
44.7
11.7
12.0
20.0
26.5
6.7
6.1
Indoco Remedies
Sell
260
153
2,395
1,154
1,310
14.9
14.9
11.3
12.7
23.0
20.5
3.3
2.9
15.0
15.0
2.2
1.9
Stock Watch
November 03, 2017
Company Name
Reco
CMP
Target
Mkt Cap
Sales ( Čcr )
OPM(%)
EPS (Č)
PER(x)
P/BV(x)
RoE(%)
EV/Sales(x)
(Č)
Price ( Č)
( Č cr )
FY18E FY19E
FY18E
FY19E
FY18E
FY19E
FY18E
FY19E
FY18E
FY19E
FY18E
FY19E
FY18E
FY19E
Pharmaceuticals
Ipca labs
Neutral
527
-
6,645
3,593
4,022
14.5
15.5
19.4
25.2
27.2
20.9
2.5
2.2
9.5
11.2
1.9
1.7
Lupin
Buy
1,061
1,467
47,931
18,657
21,289
21.3
23.3
52.8
66.7
20.1
15.9
3.0
2.6
16.3
17.5
2.6
2.1
Natco Pharma
Accumulate
997
1,057
17,373
1,886
2,016
32.3
29.5
23.2
22.0
43.1
45.2
9.0
8.0
20.9
17.6
9.1
8.4
Sun Pharma
Neutral
563
-
135,126
32,899
36,451
26.9
25.4
31.6
32.3
17.8
17.4
3.1
2.7
18.7
18.8
3.7
3.2
Syngene International
Accumulate
502
557
10,033
1,402
1,823
32.8
36.0
15.9
20.7
31.6
24.3
5.9
4.9
18.7
20.0
7.1
5.5
Power
Tata Power
Neutral
85
-
22,936
32,547
33,806
20.5
20.5
4.7
5.4
18.0
15.9
1.7
1.5
10.5
10.5
1.7
1.6
NTPC
Neutral
181
-
148,831
86,070
101,246
28.3
30.7
12.9
16.2
14.0
11.1
1.4
1.3
10.6
12.4
3.1
2.8
Power Grid
Neutral
215
-
112,479
29,183
32,946
89.7
90.0
18.0
20.8
12.0
10.3
2.0
1.8
17.7
18.2
7.8
7.2
Real Estate
Prestige Estate
Neutral
299
-
11,207
4,607
5,146
21.0
22.2
7.9
9.8
37.8
30.5
2.3
2.2
10.3
12.0
3.6
3.3
MLIFE
Buy
433
522
2,224
487
590
12.3
17.8
21.0
31.2
20.6
13.9
1.1
1.0
5.2
7.4
3.3
2.7
Telecom
Bharti Airtel
Neutral
543
-
217,099
97,903
105,233
36.0
36.3
9.3
11.1
58.4
49.2
2.8
2.7
5.0
5.6
3.2
2.9
Idea Cellular
Neutral
107
-
38,431
35,012
37,689
27.1
27.7
(4.4)
(2.7)
1.7
1.7
(6.8)
(4.6)
2.4
2.2
zOthers
Abbott India
Neutral
4,326
-
9,193
3,244
3,723
14.9
16.1
167.5
209.4
25.8
20.7
5.7
4.8
23.7
24.8
2.5
2.1
Asian Granito
Accumulate
503
570
1,512
1,169
1,286
12.5
12.5
16.0
19.7
31.5
25.5
3.4
3.0
10.7
11.6
1.5
1.4
Bajaj Electricals
Neutral
392
-
3,977
4,646
5,301
6.7
7.6
16.1
22.3
24.3
17.6
4.0
3.4
16.4
19.2
0.8
0.8
Banco Products (India)
Neutral
218
-
1,559
1,530
1,695
13.2
12.7
19.0
20.0
11.5
10.9
1.8
1.6
0.2
0.2
0.9
103.2
Coffee Day Enterprises
Neutral
223
-
4,594
3,494
3,913
17.4
18.0
4.8
5.7
-
39.1
2.0
1.9
-
0.1
1.8
1.6
Ltd
Elecon Engineering
Neutral
73
-
816
171
201
15.0
16.2
36.0
43.0
2.0
1.7
0.2
0.2
0.1
0.1
4.1
3.5
Garware Wall Ropes
Neutral
923
-
2,020
928
1,003
15.2
15.2
39.4
43.2
23.4
21.4
3.9
3.3
16.5
15.4
2.0
1.8
Goodyear India*
Neutral
811
-
1,871
1,717
1,866
11.8
12.3
47.9
49.8
16.9
16.3
2.6
2.3
15.6
15.7
0.8
112.3
Hitachi
Neutral
2,341
-
6,366
2,355
2,715
10.3
10.8
49.0
60.9
47.8
38.4
11.2
8.8
0.2
0.2
2.7
2.3
HSIL
Neutral
418
-
3,022
2,240
2,670
14.6
15.0
17.0
22.0
24.6
19.0
2.0
1.9
0.1
0.1
1.6
1.3
Interglobe Aviation
Neutral
1,248
-
45,136
22,570
27,955
14.2
15.0
63.6
81.8
19.6
15.3
10.3
8.7
0.5
0.6
1.7
1.3
Jyothy Laboratories
Neutral
390
-
7,090
1,781
2,044
14.1
15.0
9.4
10.5
41.7
37.2
8.9
8.3
0.2
0.2
4.2
3.6
Linc Pen & Plastics
Neutral
245
-
362
420
462
9.3
9.3
15.3
17.1
16.0
14.3
2.7
2.8
16.9
19.5
0.9
0.8
M M Forgings
Neutral
839
-
1,013
542
642
20.1
21.0
41.6
56.8
20.2
14.8
2.8
2.4
0.1
0.2
2.3
2.0
Mirza International
Neutral
165
-
1,987
1,148
1,285
18.0
18.0
8.0
9.4
20.6
17.7
3.4
2.9
16.3
16.1
1.9
1.7
Navkar Corporation
Buy
194
265
2,759
561
617
41.5
41.5
11.5
12.7
16.8
15.2
1.8
1.6
10.5
10.4
5.6
4.9
Nilkamal
Neutral
1,620
-
2,417
2,317
2,525
11.4
11.1
96.0
105.0
16.9
15.4
2.9
2.5
0.2
0.2
1.0
0.9
Stock Watch
November 03, 2017
Company Name
Reco
CMP
Target Mkt Cap
Sales ( Čcr )
OPM(%)
EPS (Č)
PER(x)
P/BV(x)
RoE(%)
EV/Sales(x)
(Č)
Price ( Č)
( Č cr )
FY18E FY19E FY18E FY19E FY18E FY19E FY18E FY19E FY18E FY19E FY18E FY19E FY18E FY19E
zOthers
Parag Milk Foods
Neutral
271
-
2,283
1,987
2,379
7.6
9.0
12.4
18.3
21.9
14.8
3.1
2.7
8.2
13.2
1.3
1.1
Radico Khaitan
Neutral
212
-
2,819
1,811
1,992
13.2
13.2
8.1
8.8
26.1
24.0
2.6
2.9
10.1
12.0
1.9
1.7
Relaxo Footwears
Neutral
587
-
7,046
1,981
2,310
13.7
14.5
12.0
15.5
48.9
37.8
9.5
7.7
0.2
0.2
3.6
3.1
Siyaram Silk Mills
Accumulate
595
650
2,791
1,769
1,981
12.7
12.7
22.6
26.2
26.3
22.7
4.1
3.5
15.5
15.5
1.8
1.6
Styrolution ABS India* Neutral
950
-
1,671
1,800
1,980
8.0
8.1
42.0
46.2
22.6
20.6
2.5
2.3
0.1
0.1
1.0
1.0
Surya Roshni
Neutral
369
-
1,618
4,870
5,320
7.7
7.8
22.8
28.1
16.2
13.1
2.1
1.9
0.1
0.1
0.6
0.5
TVS Srichakra
Neutral
3,180
-
2,435
2,729
2,893
12.7
12.5
248.5
265.0
12.8
12.0
3.6
3.0
0.3
0.3
0.9
0.8
Visaka Industries
Neutral
666
-
1,058
1,104
1,214
12.1
12.6
31.0
37.9
21.5
17.6
2.6
2.3
0.1
0.1
1.2
1.1
VIP Industries
Accumulate
280
300
3,958
1,450
1,693
10.4
10.5
6.5
7.8
42.8
35.9
9.1
7.9
21.1
22.1
2.7
2.3
Navin Fluorine
Neutral
734
-
3,617
945
1,154
22.4
22.6
28.7
34.8
25.6
21.1
4.2
3.6
-
-
3.3
2.6
Source: Company, Angel Research; Note: *December year end; #September year end; &October year end; Price as on November 02, 2017
Market Outlook
November 03, 2017
Research Team Tel: 022 - 39357800
DISCLAIMER
Angel Broking Private Limited (hereinafter referred to as “Angel”) is a registered Member of National Stock Exchange of India
Limited,Bombay Stock Exchange Limited and Metropolitan Stock Exchange Limited. It is also registered as a Depository Participant with
CDSL and Portfolio Manager with SEBI. It also has registration with AMFI as a Mutual Fund Distributor. Angel Broking Private Limited is a
registered entity with SEBI for Research Analyst in terms of SEBI (Research Analyst) Regulations, 2014 vide registration number
INH000000164. Angel or its associates has not been debarred/ suspended by SEBI or any other regulatory authority for accessing
/dealing in securities Market. Angel or its associates/analyst has not received any compensation / managed or
co-managed public offering of securities of the company covered by Analyst during the past twelve months.
This document is solely for the personal information of the recipient, and must not be singularly used as the basis of any investment
decision. Nothing in this document should be construed as investment or financial advice. Each recipient of this document should make
such investigations as they deem necessary to arrive at an independent evaluation of an investment in the securities of the companies
referred to in this document (including the merits and risks involved), and should consult their own advisors to determine the merits and
risks of such an investment.
Reports based on technical and derivative analysis center on studying charts of a stock's price movement, outstanding positions and
trading volume, as opposed to focusing on a company's fundamentals and, as such, may not match with a report on a company's
fundamentals. Investors are advised to refer the Fundamental and Technical Research Reports available on our website to evaluate the
contrary view, if any.
The information in this document has been printed on the basis of publicly available information, internal data and other reliable
sources believed to be true, but we do not represent that it is accurate or complete and it should not be relied on as such, as this
document is for general guidance only. Angel Broking Pvt. Limited or any of its affiliates/ group companies shall not be in any way
responsible for any loss or damage that may arise to any person from any inadvertent error in the information contained in this report.
Angel Broking Pvt. Limited has not independently verified all the information contained within this document. Accordingly, we cannot
testify, nor make any representation or warranty, express or implied, to the accuracy, contents or data contained within this document.
While Angel Broking Pvt. Limited endeavors to update on a reasonable basis the information discussed in this material, there may be
regulatory, compliance, or other reasons that prevent us from doing so.
This document is being supplied to you solely for your information, and its contents, information or data may not be reproduced,
redistributed or passed on, directly or indirectly.
Neither Angel Broking Pvt. Limited, nor its directors, employees or affiliates shall be liable for any loss or damage that may arise from
or in connection with the use of this information.